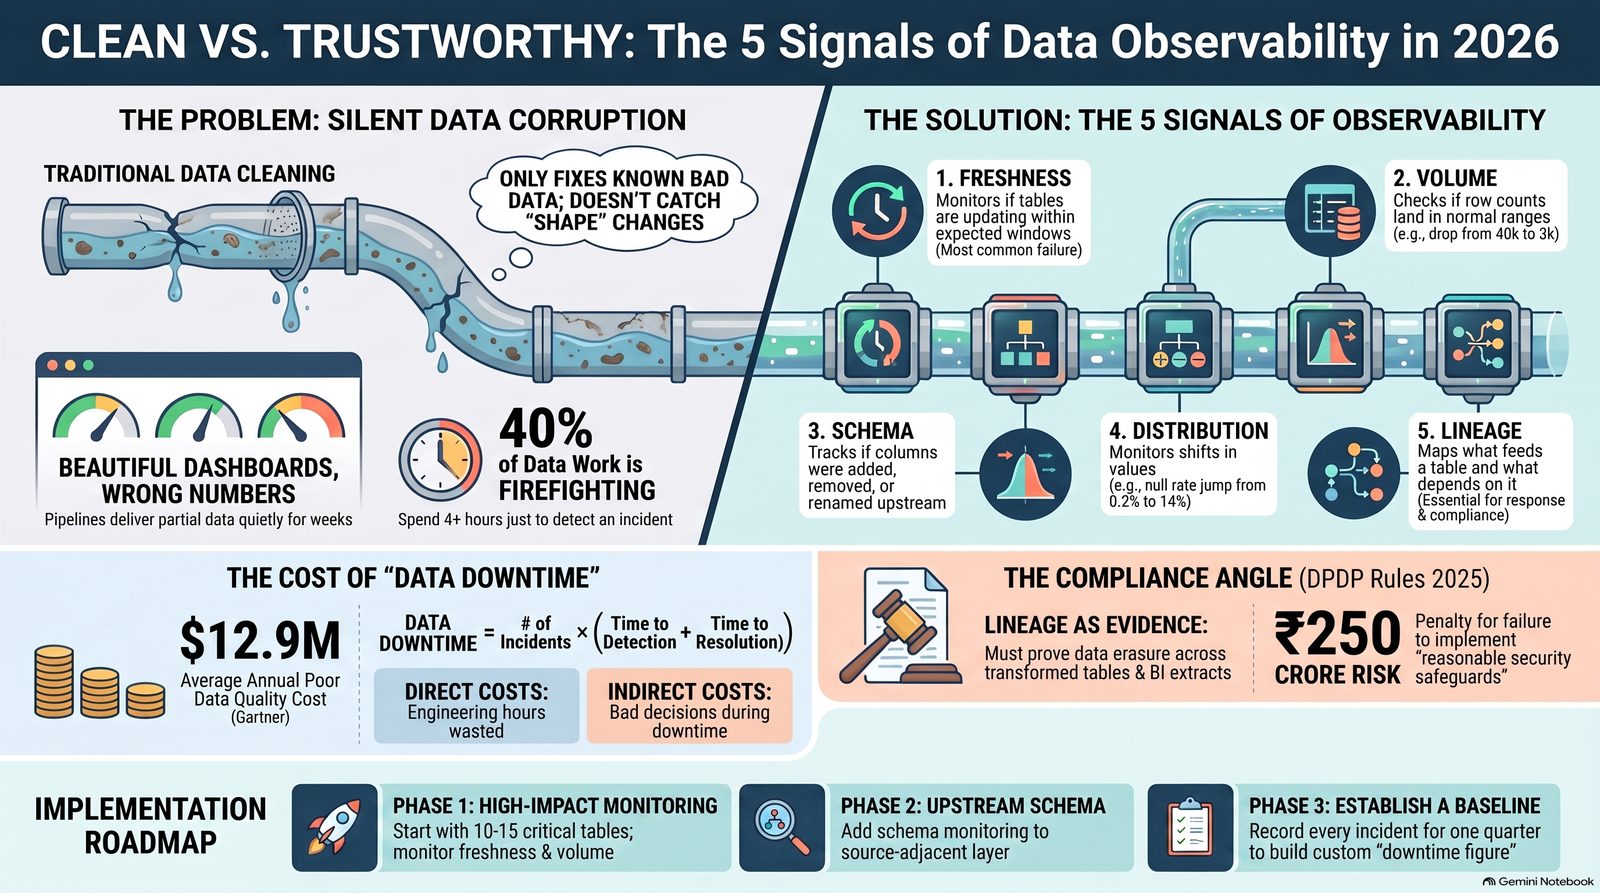
Data observability monitors freshness, volume, schema, distribution and lineage — the five signals that catch pipelines silently changing shape, which data cleaning alone will never catch because cleaning only fixes data you already know is bad. By 2026 it's difficult to justify an AI-driven analytics programme without it, since an autonomous agent fed silently corrupted input fails just as confidently as it succeeds.
There is a specific kind of meeting that every analytics leader has been in. A senior stakeholder is presenting a number. Someone in the room says that number looks wrong. It is wrong. It has been wrong for three weeks. Nobody noticed because nothing broke loudly — a pipeline just started delivering partial data, quietly, and every downstream dashboard kept rendering beautifully.
Data cleaning would not have caught this. Cleaning fixes data you already know is bad. What was needed was something monitoring whether the data changed shape.
That is data observability, and it became a mainstream budget line rather than a specialist concern somewhere around 2024. By 2026 it is difficult to justify an AI-driven analytics programme without it, for reasons that become obvious once you consider what an autonomous agent does with silently corrupted input.
The five signals
Observability platforms monitor a fairly consistent set of dimensions.
Freshness — when did this table last update, and is that within its expected window? The most common failure, and the easiest to detect.
Volume — did the row count land in its normal range? A table that usually receives 40,000 rows a day receiving 3,000 is broken even if all 3,000 rows are individually valid.
Schema — did columns get added, removed, renamed or retyped upstream? This is where most breakages originate, because source system owners have no reason to know who depends on them.
Distribution — did the values themselves shift? Null rate jumping from 0.2% to 14%, a categorical field acquiring a new value, a numeric field's mean moving three standard deviations. This catches the subtlest and most dangerous class of failure.
Lineage — what feeds this table, and what depends on it? Without lineage, incident response becomes archaeology.
The cost of not having it
The industry's favourite statistic is Gartner's estimate that poor data quality costs organisations an average of USD 12.9 million per year. It gets cited constantly, almost never with provenance, so here it is.
The figure comes from Gartner's Magic Quadrant for Data Quality Solutions, published 27 July 2020. Gartner surveyed 154 reference customers across 16 data quality vendors and asked them to estimate what poor data quality cost their organisation. So: self-reported estimates, from large enterprises already sophisticated enough to be buying data quality software, from 2020.
That context does not invalidate it. But if you are quoting it in a business case, quote it honestly — as an indicative average from a specific enterprise population, not as a law of nature. An analytics function that misuses statistics in its own funding pitch has a credibility problem before it starts.
The more useful numbers are operational. Monte Carlo's 2022 survey with Wakefield Research found 75% of respondents needed four or more hours simply to detect a data quality incident, and about half needed around nine hours to resolve it once identified. Data professionals reported spending roughly 40% of their time on data quality work.
Multiply detection time by incident frequency by the number of downstream decisions made on stale data, and you get a figure specific to your organisation. That number is far more persuasive to a CFO than someone else's average.
Building your own downtime number
A workable formula:
Data downtime = number of incidents × (time to detection + time to resolution)
Then attach cost in two layers. Direct cost is engineering hours consumed by firefighting rather than building. Indirect cost is decisions made on wrong data during the downtime window — harder to quantify, usually larger.
Start measuring incidents before you buy anything. Most teams discover they have between three and ten times more incidents than they assumed, because the ones nobody noticed were never counted.
Observability and the compliance angle
For Indian enterprises there is a second reason this matters in 2026, and it is not about analytics quality at all.
The DPDP Rules, 2025 came into force in phases from 13 November 2025, with full substantive obligations landing 13 May 2027. Among those obligations are reasonable security safeguards, breach notification, and honouring data principal rights including correction and erasure.
Consider what erasure means operationally. A customer exercises their right to have data erased. Your CRM honours it. But that customer's records were replicated into a warehouse, transformed into three modelled tables, cached in a BI extract, and fed a churn model's training set. Without lineage, you cannot prove — to yourself or to the Data Protection Board — that erasure propagated.
Lineage stops being an engineering convenience at that point and becomes evidence. The Act's Schedule sets a ceiling of up to ₹250 crore for failure to implement reasonable security safeguards, so the question of whether your controls are demonstrable is not academic.
What observability does not solve
Three honest limitations.
It does not tell you a number is wrong, only that it changed unexpectedly. A revenue figure that has been calculated with incorrect business logic since day one will pass every freshness, volume and distribution check ever written. Semantic correctness is a different problem, solved by definitions and testing, not monitoring.
It generates alert fatigue if configured naively. Every table monitored on every dimension with default thresholds produces noise, and a team that learns to ignore alerts is worse off than one with no alerts, because it has false confidence.
And it is not free. Both the tooling and, more significantly, the ownership. Somebody has to triage.
A pragmatic starting sequence
If you are starting from zero, resist the urge to instrument everything.
Begin by identifying the ten to fifteen tables that feed decisions someone actually makes — the board pack, the pricing model, the inventory reorder logic. Monitor freshness and volume on those first, because they catch the majority of incidents for the least configuration effort. Add schema monitoring on the source-adjacent layer, since that is where breakages originate. Add distribution monitoring last, and only on fields where you can articulate what abnormal looks like.
Record every incident from day one — what broke, when it broke, when you found out, how long to fix, what decisions were affected. After a quarter you will have your own downtime figure, grounded in your own operations, which is worth considerably more than any industry average.
Then, and only then, have the budget conversation.
Cleaning fixes data you already know is bad. What was needed was something monitoring whether the data changed shape.
Referenced in this piece: Monte Carlo — data observability.
Want this level of rigor applied to your own analytics stack?
This guide comes from running BA/BI systems audits for real Indian enterprises — where the actual fix is decided by which stage of your analytics function is broken, not by which tool has the best demo. A Systems Audit tells you exactly where to start.
Book a Systems Audit arrow_forward