The six-stage business analytics lifecycle — collection, cleaning, storage, analysis, visualisation, action — gives you a checklist for locating where a broken analytics function actually breaks, and it's almost never the stage the strategy deck focuses on. Investment tends to flow toward the visible stages (analysis, visualisation); failure tends to originate in the invisible ones (cleaning/observability, and action/evaluation).
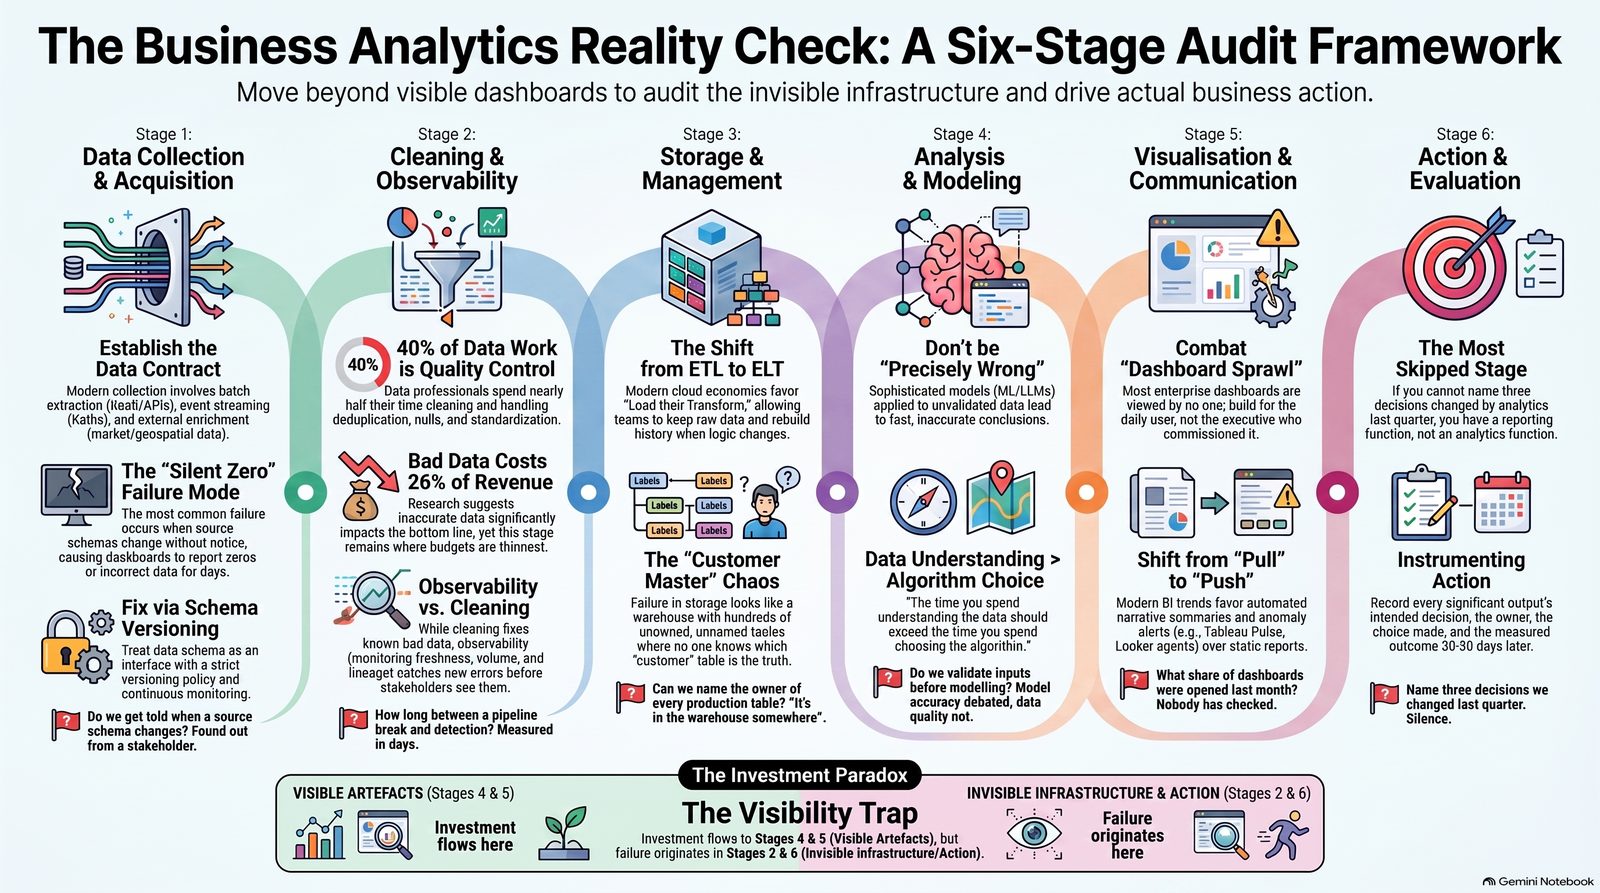
Every textbook version of the analytics lifecycle looks like a clean left-to-right pipeline. Every real one looks like a plumbing diagram drawn by someone who was interrupted.
The six-stage framework below is still worth using, not because reality is that tidy but because it gives you a checklist for locating where a broken analytics function is actually broken. In my experience of auditing these, the answer is almost never the stage people think.
Stage 1: Data collection and acquisition
Getting data out of source systems and into somewhere you can work with it.
In 2026 this means a mix of three patterns. Batch extraction from application databases and SaaS APIs — CRM, ERP, payment gateway, marketing platforms. Event streaming through Kafka or a managed equivalent, for anything where latency matters. External enrichment — market data, geospatial, credit bureau, third-party demographic feeds.
The failure mode: nobody owns the contract between source and pipeline. A product team renames a column in a release, no one tells the data team, and a dashboard silently reports zeros for eleven days. This is not a hypothetical — it is the single most common incident type in every data team I have seen.
The fix: treat schema as an interface with a versioning policy, and monitor it.
Stage 2: Cleaning and observability
This is where the real work lives, and where budgets are thinnest.
Cleaning is deduplication, type coercion, null handling, standardising the eleven ways your systems spell "Uttar Pradesh". Observability is the newer and more important half — continuous monitoring of pipeline health across freshness, volume, schema, distribution and lineage.
The distinction matters. Cleaning fixes data you know is bad. Observability tells you data has gone bad before a stakeholder discovers it in a board meeting.
The scale of the problem is documented. Monte Carlo's 2022 survey of over 300 data professionals, conducted with Wakefield Research, found practitioners spending around 40% of their time on data quality work, with 75% taking four or more hours just to detect an incident and roughly half taking around nine hours to resolve it once found. Respondents estimated bad data affected 26% of company revenue.
Those are self-reported figures from a survey commissioned by a data observability vendor, which is worth stating plainly. But the direction is corroborated by anyone who has run a data team.
The failure mode: treating cleaning as a one-time project rather than a permanent operating cost.
Stage 3: Storage and management
The cloud warehouse or lakehouse — Snowflake, Databricks, BigQuery — plus the transformation layer that shapes raw data into modelled tables.
The architectural shift here is from ETL to ELT. Older pipelines transformed data before loading it, because storage and compute were expensive and you only wanted to keep the finished product. Cloud economics inverted that: load raw data first, transform inside the warehouse where compute is elastic, and keep the raw layer so you can rebuild when logic changes.
That last property is underrated. With ELT, discovering a two-year-old bug in your revenue logic means rerunning a transformation. With ETL, it means the raw data is gone and you cannot fix history.
The failure mode: a warehouse with 400 tables, no naming convention, no ownership, and three tables that all look like they might be the customer master.
Stage 4: Analysis and modelling
Statistical technique and machine learning applied to modelled data. Regression for relationships, classification for categorical outcomes, time-series for forecasting, clustering for segmentation, and increasingly NLP and LLMs for unstructured text.
The failure mode: model sophistication running ahead of data reliability. A gradient boosted model on a table nobody validated is a very fast way to be precisely wrong.
A practical rule: the time you spend understanding the data should exceed the time you spend choosing the algorithm. If it does not, you are doing Kaggle, not analytics.
Stage 5: Visualisation and communication
Dashboards, reports, narratives, alerts. The interface between the analytical system and the human who must act.
Two decades of self-service BI have produced an unintended consequence — dashboard sprawl. The average enterprise has hundreds, most viewed by nobody. This is why the 2026 vendor direction is toward push rather than pull: Tableau Pulse delivering metric changes to users, Looker agents monitoring models and flagging anomalies, Power BI narrative summaries generated on demand.
The failure mode: building for the person who commissioned the dashboard rather than the person who will use it daily. These are rarely the same person.
Stage 6: Action and evaluation
Did a decision get made? Did the KPI move? Would we do it again?
This stage is skipped almost universally, and skipping it is the reason analytics functions struggle to defend their budgets. If you cannot name three decisions that changed because of your work last quarter, you have a reporting function, not an analytics function — and reporting functions get cut first when budgets tighten.
Instrumenting stage six is not complicated. For each significant analytical output, record what decision it was meant to inform, who owned that decision, what they chose, and what the measured outcome was 30, 60 or 90 days later. Most of the entries will be "no decision was made". That itself is the most valuable finding you will get all year.
The failure mode: believing that shipping the insight was the job.
Using the framework as a diagnostic
Run your own function against these six questions:
| Stage | Diagnostic question | Red flag |
|---|---|---|
| 1. Collection | Do we get told when a source schema changes? | Found out from a stakeholder |
| 2. Cleaning | How long between a pipeline break and detection? | Measured in days |
| 3. Storage | Can we name the owner of every production table? | "It's in the warehouse somewhere" |
| 4. Analysis | Do we validate inputs before modelling? | Model accuracy debated, data quality not |
| 5. Visualisation | What share of dashboards were opened last month? | Nobody has checked |
| 6. Action | Name three decisions we changed last quarter | Silence |
Wherever the first red flag appears, that is where your budget goes — not the stage that sounds most interesting in a strategy deck.
The uncomfortable pattern
Analytics investment tends to flow toward stages 4 and 5, because those produce visible artefacts. Analytics failure tends to originate in stages 2 and 6, because those produce nothing visible until something breaks or someone asks what the function is for.
Reversing that allocation is the highest-leverage change most Indian enterprises could make to their analytics programme in 2026.
Analytics investment flows toward the stages that produce visible artefacts. Analytics failure originates in the stages that produce nothing visible until something breaks.
Referenced in this piece: Monte Carlo — data quality & observability research.
Want this level of rigor applied to your own analytics stack?
This guide comes from running BA/BI systems audits for real Indian enterprises — where the actual fix is decided by which stage of your analytics function is broken, not by which tool has the best demo. A Systems Audit tells you exactly where to start.
Book a Systems Audit arrow_forward