Four Indian-market analytics use cases — customer lifetime value in marketing, credit risk and fraud in BFSI, demand forecasting in retail, and route/inventory optimisation in logistics — each described by the specific decision they serve rather than the model technique. Across all four, the failure mode is almost never algorithmic: it's data that doesn't reflect operational reality, or nobody having asked the person who actually does the job what happens on the ground.
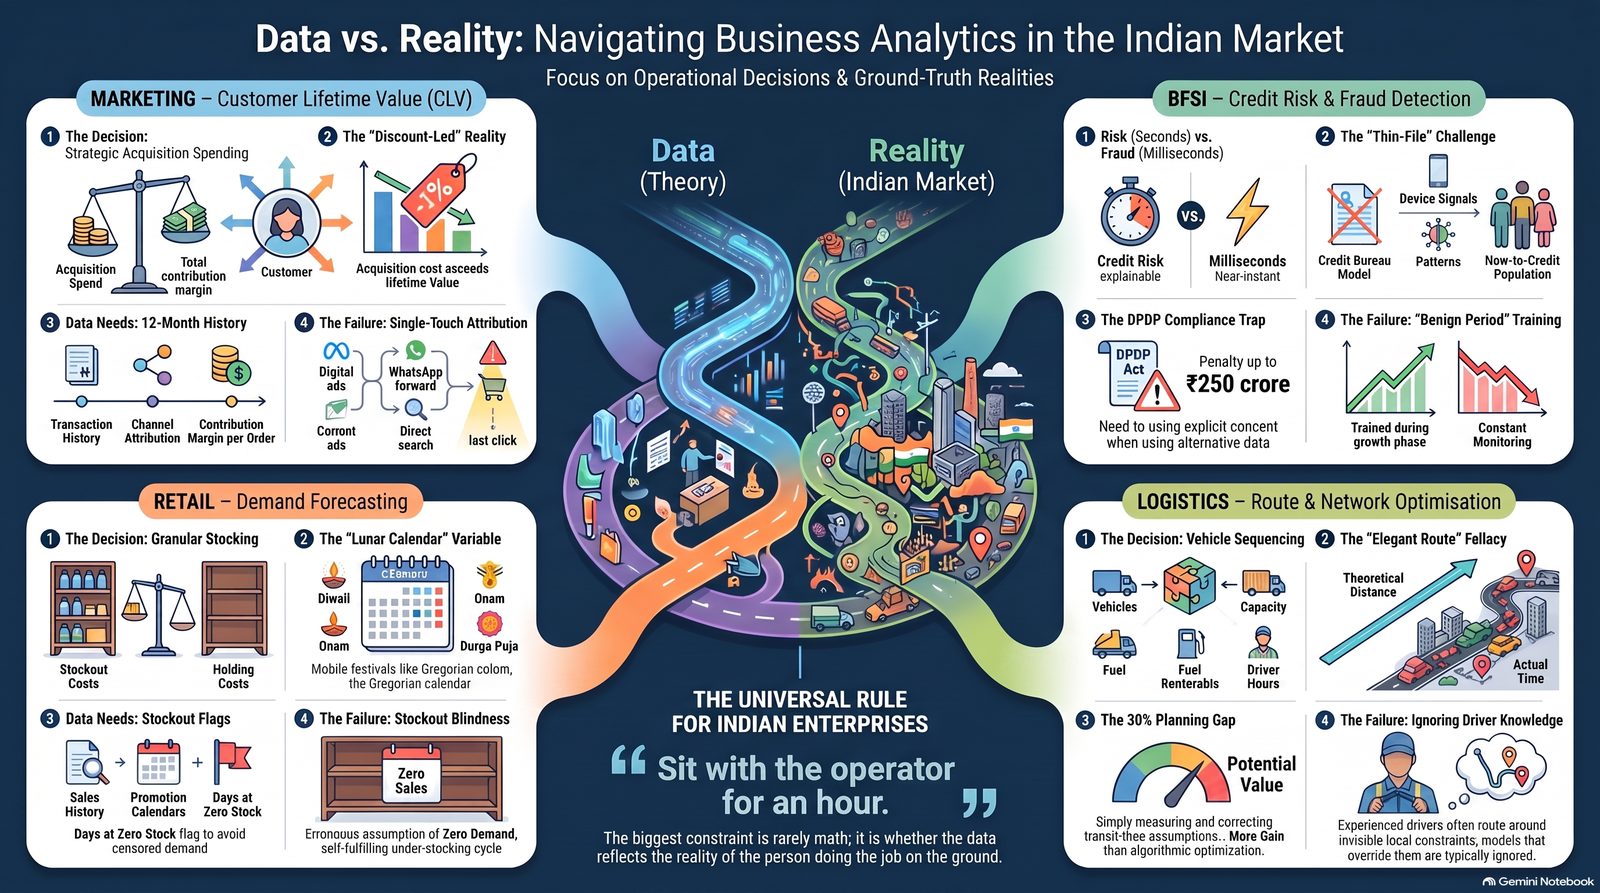
Generic use case lists are useless because they describe the model rather than the decision. "Fraud detection" tells you nothing about who acts on the output, within what window, under what constraint.
Below are four domains where analytics reliably creates value in the Indian market, described in terms of the decision each one serves — and the specific ways each tends to go wrong here rather than in a textbook.
Marketing: customer lifetime value and cohort economics
The decision: how to allocate acquisition spend across channels next month.
What the analysis does: estimates the total contribution margin a customer will generate over their relationship, segmented by acquisition cohort and channel, then compares that against blended acquisition cost per channel.
Why it matters in India specifically: the discount-led acquisition playbook that dominated Indian consumer internet produced enormous cohorts of customers whose lifetime value never exceeded their acquisition cost. CLV analysis is the mechanism that makes this visible before the next funding round makes it unavoidable.
Data needed: transaction history with customer identifiers, acquisition channel attribution, contribution margin per order (not revenue — margin), and enough history to observe repeat behaviour, typically twelve months minimum.
Where it fails: attributing customers to a single channel in a market where the actual path involves a Meta ad, a WhatsApp forward and a direct search. Single-touch attribution systematically overstates the last channel. Treat CLV by channel as directional, and validate with holdout tests rather than trusting the attribution model.
Related technique: RFM segmentation — recency, frequency, monetary value — remains the highest return-per-hour analysis in retail and D2C, and requires nothing more than transaction data.
BFSI: credit risk and fraud detection
The decision, for credit risk: approve, decline, or price this application, in seconds.
The decision, for fraud: allow, challenge or block this transaction, in milliseconds.
These are different problems despite being adjacent. Credit risk tolerates latency and demands explainability. Fraud demands speed and tolerates opacity within limits.
What the analysis does: credit models estimate default probability from bureau data, application attributes, and increasingly alternative data — transaction patterns, device signals, employment stability. Fraud models detect anomalous patterns against a behavioural baseline.
Why it matters in India specifically: a large share of the addressable population is thin-file or new-to-credit, so pure bureau-driven models decline creditworthy applicants. Alternative data is what expands the approvable population — which is exactly why it collides with data protection obligations.
Data needed: for credit, bureau pulls, application data, repayment history, and a sufficiently long outcome window to observe defaults. For fraud, high-frequency transaction streams with device and behavioural signals.
Where it fails: models trained on a benign period do not anticipate a shift in fraud pattern, and portfolio models built during a growth phase understate risk in a downturn. Both need monitoring for population drift, not annual revalidation.
The compliance dimension is not optional. Alternative data models process personal data, often extensively. Under the DPDP framework, that processing requires valid consent for a specified purpose, and consent state must remain visible to the modelling layer. A risk model quietly training on records where consent was withdrawn is a live compliance exposure, and the Act's penalty schedule reaches ₹250 crore for security safeguard failures with a residual tier of ₹50 crore for other contraventions.
Retail: demand forecasting
The decision: how much of each SKU to hold at each location, and when to reorder.
What the analysis does: forecasts demand at the granularity at which inventory decisions are made — typically SKU by location by week — and feeds reorder quantities that balance stockout cost against holding cost.
Why it matters in India specifically: festival seasonality is severe, geographically variable and lunar-calendar-dependent. A model trained on Gregorian seasonality will systematically miss Diwali, and Diwali moves. Regional festivals compound this — Onam demand in Kerala, Durga Puja in West Bengal, Pongal in Tamil Nadu — meaning a single national model will be wrong in different directions in different states.
Data needed: sales history at decision granularity, stockout flags (critical — days with zero sales because of zero stock are not days of zero demand), promotion calendar, and a festival calendar with actual dates by year.
Where it fails: the stockout blindness problem above is the single most common error. Censored demand is recorded as low demand, the model forecasts low, less stock is sent, and the error compounds. Any forecasting project in retail should start by auditing whether stockouts are recorded at all.
Accuracy that matters: national-level accuracy is irrelevant. Measure at the granularity of the decision — SKU-location — where accuracy is always dramatically lower and always more honest.
Logistics: route and network optimisation
The decision: which vehicle carries which shipments, on which route, in what sequence.
What the analysis does: constrained optimisation across vehicle capacity, delivery time windows, driver hours, fuel cost and distance.
Why it matters in India specifically: road conditions, inter-state checkpoints, urban congestion patterns and last-mile access constraints make theoretical distance a poor proxy for actual time. Optimisation on straight-line distance produces routes that look elegant and take forty percent longer than planned.
Data needed: historical actual transit times per lane and time-of-day, vehicle specifications and constraints, delivery time windows, and realistic service time per stop.
Where it fails: optimisation that ignores driver knowledge. Experienced drivers route around problems the model cannot see. A system that overrides them without explanation gets ignored, and the analytics team concludes the drivers are irrational rather than that the model is under-specified.
The prerequisite most projects skip: you cannot optimise what you have not measured. Before building a routing model, instrument actual transit times. Many firms discover their planning assumptions were off by thirty percent, and simply correcting those assumptions delivers most of the available gain without any optimisation at all.
The pattern across all four
Notice what the failure modes have in common. Almost none are modelling failures. They are failures of data availability, granularity mismatch, or ignoring context the operating team already knew.
That is the general lesson. In Indian enterprises, the constraint on analytics value is rarely algorithmic sophistication. It is whether the data reflects operational reality, and whether anyone asked the person who does the job what actually happens.
Start every use case by sitting with that person for an hour. It will save you a quarter.
The constraint on analytics value is rarely algorithmic sophistication. It is whether the data reflects operational reality.
Referenced in this piece: Gartner — Top Predictions for Data and Analytics.
Want this level of rigor applied to your own analytics stack?
This guide comes from running BA/BI systems audits for real Indian enterprises — where the actual fix is decided by which stage of your analytics function is broken, not by which tool has the best demo. A Systems Audit tells you exactly where to start.
Book a Systems Audit arrow_forward