Enterprise business analytics in 2026 is less about new tools and more about trust and action — whether people believe the number on screen and whether anything happens because of it. This guide maps business analytics against BI and decision intelligence, the tooling landscape (Power BI, Tableau, Looker, and open source), how to measure ROI honestly, and India's DPDP compliance deadline. Start with whichever section names your actual bottleneck, not the one that sounds most urgent.
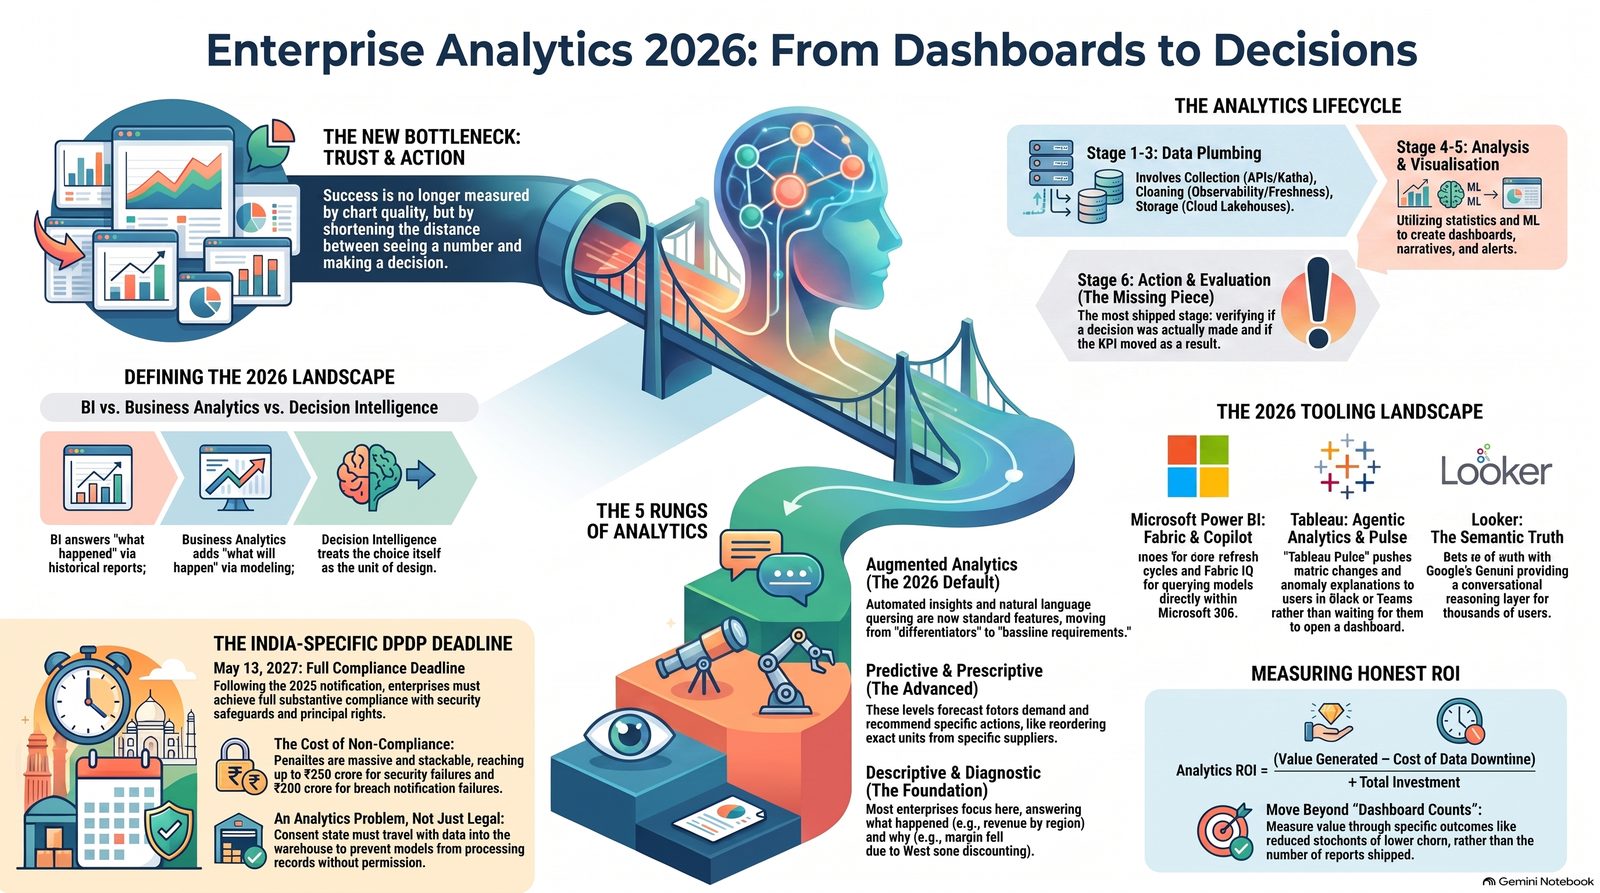
Something changed in enterprise analytics between 2024 and 2026, and it was not the arrival of AI. AI had already arrived. What changed was where the bottleneck moved.
For a decade the bottleneck was access. Business teams could not get to their numbers without filing a ticket and waiting three days for an analyst. Self-service BI was built to solve exactly that, and broadly it did. By 2026 the average mid-sized Indian enterprise has more dashboards than it has people who look at them.
The bottleneck now is trust and action. Can you believe the number on the screen, and does anything actually happen because of it? Every serious development in the field this year — semantic layers, data observability, agentic analytics, India's DPDP Rules — is an answer to one of those two questions.
This guide maps the territory. Each section is a summary; the linked deep-dives go further.
1. Business analytics, business intelligence, and decision intelligence
These three terms get used interchangeably, and the confusion costs real money during vendor selection.
Business intelligence answers what happened. It is the reporting and dashboarding layer sitting on historical, structured data — governed, repeatable, audit-friendly.
Business analytics is the wider discipline. It includes BI but extends into statistical modelling, forecasting and machine learning, and its output is a recommendation rather than a report.
Decision intelligence is the newer frame, and the most useful one. It treats the decision itself as the unit of design: what choice is being made, who makes it, what information they need, and how the outcome gets measured. Under this lens a dashboard nobody acts on is not a partial success. It is a failed decision system.
The practical implication for 2026: stop evaluating tools by chart quality and start evaluating them by whether they shorten the distance between a number and a decision.
2. The four types of analytics — and the fifth that became default
The classic ladder still holds:
| Type | Question | Typical output |
|---|---|---|
| Descriptive | What happened? | Monthly revenue by region |
| Diagnostic | Why did it happen? | Margin fell because discounting rose in the West zone |
| Predictive | What could happen? | 12-week demand forecast with confidence bands |
| Prescriptive | What should we do? | Reorder 4,200 units on 14 March at supplier B |
Most Indian enterprises are honest enough to admit they live in the first two rungs. That is fine. Predictive work built on unreliable descriptive foundations produces confident nonsense.
The addition in 2026 is augmented analytics — automated insight generation, anomaly detection and natural language querying layered across all four types. It is no longer a differentiator. It ships as standard in Power BI, Tableau and Looker. What differentiates is whether it is grounded in a governed semantic layer or improvising against raw tables.
3. The analytics lifecycle
Six stages, and the failure rate is highest in the second.
- Collection — APIs, application databases, third-party feeds, event streams via Kafka
- Cleaning and observability — validation, lineage, freshness and volume monitoring
- Storage and modelling — cloud warehouse or lakehouse, cloud-native ELT
- Analysis — statistics, ML, cohort and segmentation work
- Visualisation and communication — dashboards, narratives, alerts
- Action and evaluation — did the decision get made, and did the KPI move?
Stage six is the one most organisations skip entirely, which is why so many analytics programmes cannot prove their own worth.
4. The 2026 tooling landscape
Gartner published its Magic Quadrant for Analytics and BI Platforms on 29 June 2026, and the framing had visibly shifted toward agentic AI, governed semantics and AI-augmented decision support rather than visualisation craft.
Microsoft Power BI sits inside Microsoft Fabric. Direct Lake storage mode reads Delta Parquet files in OneLake without an import refresh cycle, and Copilot requires an F64-or-higher Fabric capacity. Microsoft's 2026 releases introduced Fabric IQ, which lets business users query Power BI semantic models from inside Microsoft 365 Copilot Chat while respecting existing permissions.
Tableau, under Salesforce, went further in naming its direction. In May 2026 it announced an agentic analytics platform spanning Cloud, Server, Desktop and Tableau Next. Tableau Pulse pushes metric changes and anomaly explanations to users rather than waiting for them to open a dashboard. Tableau MCP servers are generally available, and integrations now surface Tableau's governed semantics inside Slack, Teams and third-party assistants including Claude and ChatGPT.
Looker on Google Cloud bets everything on LookML as the semantic source of truth, with Gemini providing the reasoning layer. Google's own 2026 write-up cites PayPal scaling conversational analytics to over 3,000 users through Looker's Managed MCP offering.
Open source — Metabase for speed of deployment, Apache Superset (and its commercial form, Preset) for scale and extensibility — remains the sane choice for teams under roughly 50 users who cannot justify per-seat enterprise pricing.
Underneath all of them sit the same components: Snowflake, Databricks or BigQuery as the warehouse or lakehouse, Apache Spark for distributed processing, Kafka for streaming, and dbt for transformation.
5. Where the value actually shows up
Three deployment patterns dominate 2026.
Embedded intelligence puts analytics inside the CRM or ERP screen where work already happens, rather than in a separate BI portal. Adoption rises because nobody has to change tabs.
Real-time and edge processing moves computation closer to the source — a manufacturing line, a retail store, a logistics hub — where round-tripping to a central cloud costs more latency than the decision can afford.
Industry applications in the Indian market cluster predictably: customer lifetime value modelling in consumer marketing, credit risk and fraud detection in BFSI, demand forecasting in retail, and route and inventory optimisation in logistics.
6. Measuring ROI honestly
The most-quoted number in this field is Gartner's estimate that poor data quality costs organisations an average of USD 12.9 million a year. It is worth knowing where it comes from: the figure originates in Gartner's Magic Quadrant for Data Quality Solutions published in July 2020, based on estimates supplied by 154 reference customers of data quality vendors — large enterprises already sophisticated enough to be buying tooling for the problem.
That does not make it wrong. It makes it a self-reported average from a specific, non-representative population. Quoting it as a universal law, as most vendor blogs do, is exactly the kind of unexamined number a good analytics function exists to prevent.
A more defensible framing:
Analytics ROI = (Value generated − Cost of data downtime) ÷ Total analytics investment
Where value generated is measured in decision outcomes you can name — reduced stockouts, lower churn, faster collections — not in dashboards shipped. Supplement it with adoption-based metrics: weekly active users against licensed users, and the share of decisions traceable to a governed metric.
7. Roles and governance
A functioning analytics organisation needs four distinct capabilities, whether or not they map to four job titles: a data engineer who owns pipelines, a data analyst who owns questions, a data scientist who owns models, and a senior business analyst who owns the translation between business intent and data reality. In smaller Indian firms one person often wears three of these hats — that is survivable; pretending the fourth does not exist is not.
Governance is not documentation. It is the mechanism by which people come to believe the number. Without it, adoption stalls regardless of tooling spend.
8. The India-specific deadline
Indian analytics teams have a hard date. The Digital Personal Data Protection Rules, 2025 were notified on 13 November 2025, starting a phased rollout. The Consent Manager registration framework under Rule 4 becomes operational on 13 November 2026. Full substantive compliance — notice, consent, security safeguards, breach reporting, data principal rights — is due 13 May 2027.
Penalties under the Act's Schedule run up to ₹250 crore for failing to implement reasonable security safeguards, ₹200 crore for breach notification failure, ₹200 crore for children's data violations, ₹150 crore for Significant Data Fiduciary obligations, and ₹50 crore as the residual category. These stack. A single breach at a large institution can trigger several tiers at once.
This is an analytics problem, not only a legal one. Consent state has to travel with the data into the warehouse, or your customer segmentation model is quietly processing records it no longer has permission to touch.
Where to start
If you are early: fix descriptive reporting and metric definitions before touching predictive work. If you are mid-maturity: instrument your pipelines with observability and build a semantic layer, because every AI feature you buy next will be only as good as that layer. If you are advanced: start measuring decision outcomes, not dashboard counts — and get your consent architecture DPDP-ready well before the 2027 deadline, because the integration work takes longer than the calendar suggests.
Every serious development in the field this year is an answer to one of two questions: can you believe the number, and does anything happen because of it.
Referenced in this piece: Gartner — analytics and BI platforms research.
Want this level of rigor applied to your own analytics stack?
This guide comes from running BA/BI systems audits for real Indian enterprises — where the actual fix is decided by which stage of your analytics function is broken, not by which tool has the best demo. A Systems Audit tells you exactly where to start.
Book a Systems Audit arrow_forward