Descriptive, diagnostic, predictive and prescriptive analytics form a ladder where each rung depends entirely on the one below it — skipping ahead produces confident nonsense. Augmented analytics (automated insight, anomaly detection, natural language query) is now standard across every major platform, but it only works when it's grounded in a governed semantic layer rather than improvising against raw tables.
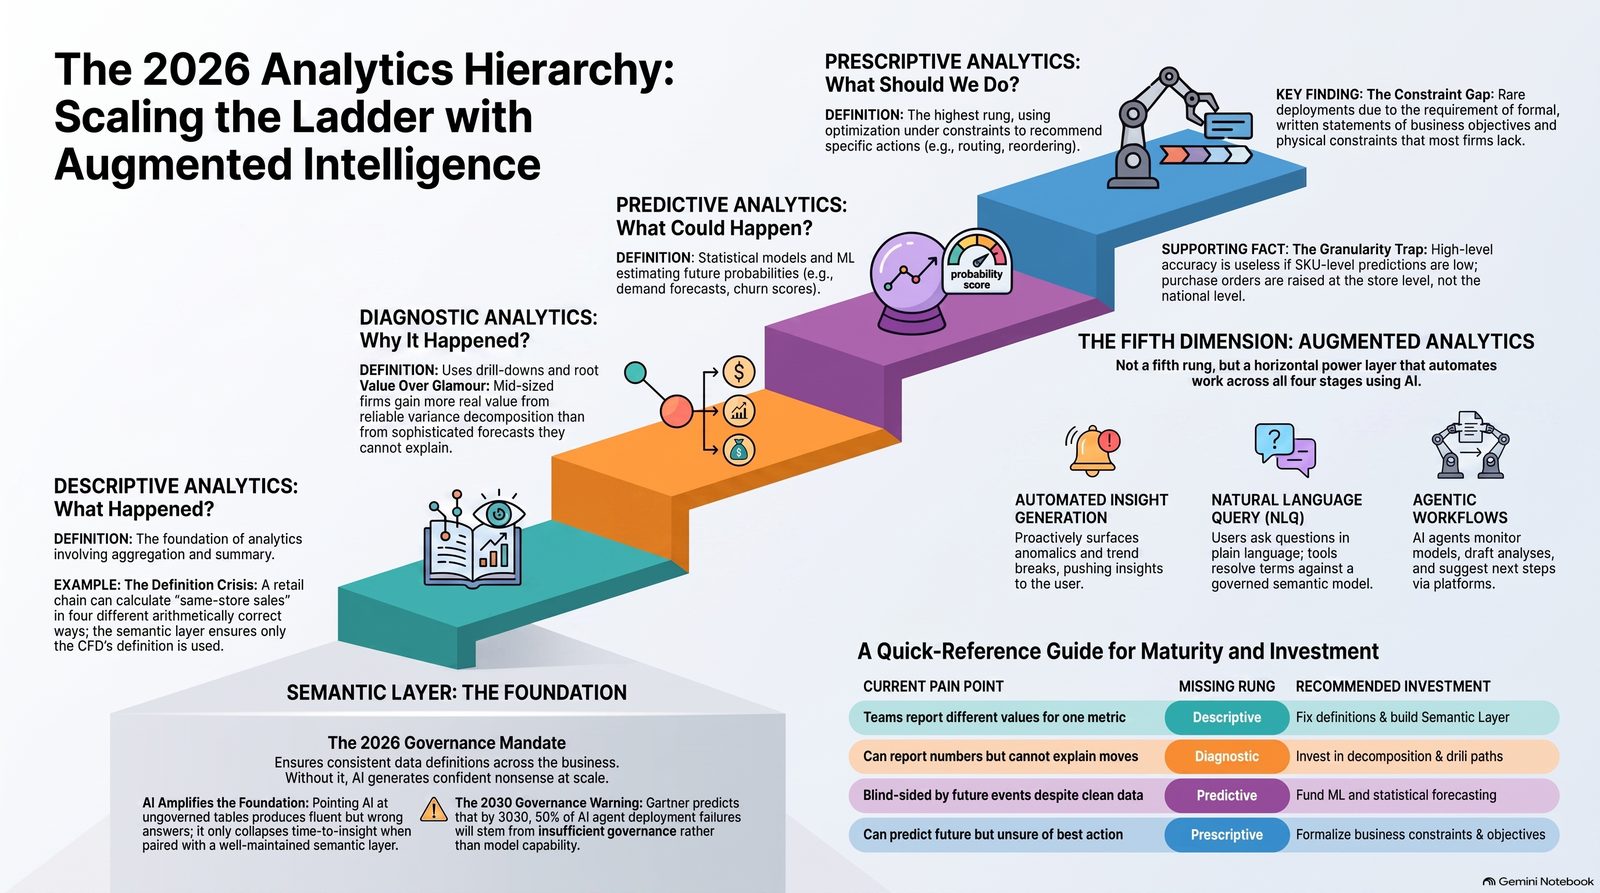
The four-type analytics ladder has been taught the same way for fifteen years, usually with a diagram where the arrow points up and to the right and the labels get progressively more exciting. It remains a genuinely useful framework. It is also routinely misused, because most organisations assume they should be climbing it as fast as possible.
They should not. Each rung depends entirely on the one below it, and skipping is expensive.
Descriptive analytics: what happened
This is aggregation and summary. Revenue by region, headcount by function, order volume by week, defect rate by shift.
It sounds trivial. It is not, and the reason is definitional rather than technical. A retail chain with 40 stores can compute "same-store sales" four different ways depending on how it treats stores that renovated mid-period. Every one of those four calculations is arithmetically correct. Only one matches what the CFO means by the term.
Descriptive analytics fails not from bad maths but from unshared definitions. This is precisely why semantic layers have become the centre of gravity in 2026 tooling — they are the mechanism that makes one definition win.
Indian example: a Bareilly-based FMCG distributor reporting weekly primary and secondary sales by SKU and beat, so the difference between what was pushed to retailers and what actually sold through becomes visible.
Diagnostic analytics: why it happened
Diagnostic work takes a movement in a descriptive number and decomposes it into contributing factors. Drill-down, cohort comparison, correlation analysis, root cause investigation.
The characteristic diagnostic question: gross margin fell 180 basis points — how much of that is mix, how much is discounting, how much is input cost?
This is where most real analytical value sits in mid-sized Indian firms, and it is systematically under-invested because it is unglamorous. Nobody puts "we built a good variance decomposition" in a board deck. But a business that can reliably explain why a number moved makes better decisions than one that can forecast it and cannot explain it.
Indian example: an NBFC finding that a rise in 30-day delinquency traces almost entirely to loans sourced through two DSA partners in a single state, rather than to any macro deterioration.
Predictive analytics: what could happen
Statistical and machine learning models that estimate future values or probabilities. Demand forecasts, churn scores, credit risk models, lead conversion likelihood.
Two things go wrong here reliably.
The first is building predictive models on descriptive foundations nobody has validated. If your customer table has duplicate records at a 6% rate, your churn model is learning something about your deduplication logic rather than your customers.
The second is confusing accuracy with usefulness. A demand forecast with 94% accuracy at the national level and 61% at the SKU-store level is useless to the person raising purchase orders, because purchase orders are raised at SKU-store level.
Indian example: a quick-commerce operator forecasting 48-hour demand per dark store per SKU, with wider confidence bands during festival weeks where historical patterns break.
Prescriptive analytics: what should we do
Prescriptive analytics goes beyond prediction to recommend a specific action, usually through optimisation under constraints. Reorder this quantity, from this supplier, on this date. Offer this discount to this segment. Route this vehicle this way.
The reason prescriptive deployments are rarer than the hype implies is that they need something the previous three do not: a formal statement of constraints and objectives. What is the holding cost, the stockout cost, the minimum order quantity, the lead time variance? Most organisations have never written these down.
Indian example: a logistics firm optimising truck loading and routing across a Delhi NCR distribution network, balancing fuel cost, delivery windows and vehicle capacity constraints.
The fifth: augmented analytics
Augmented analytics is not a fifth rung on the ladder. It is a layer that runs horizontally across all four, using AI to automate parts of the work.
It shows up in three forms:
Automated insight generation — the system surfaces anomalies, trend breaks and drivers without being asked. Tableau Pulse is the clearest expression of this: it inverts the workflow so insights find the user rather than the user hunting through dashboards, and by 2026 it explains anomaly root causes proactively.
Natural language query — asking questions in plain language rather than building a query. Looker's Conversational Analytics uses Gemini grounded in the LookML semantic model as its source of truth, so that "churn rate" resolves to the organisation's defined metric rather than to whatever the model infers. Power BI's Copilot works similarly against Fabric semantic models, and in 2026 Microsoft extended this through Fabric IQ so users can ask questions of Power BI data from inside Microsoft 365 Copilot Chat, with existing permissions respected.
Agentic workflows — the newest and least mature form, where agents monitor models, draft analyses and suggest next steps. Salesforce announced Tableau's agentic analytics platform in May 2026, with MCP servers making governed Tableau semantics available inside Slack, Teams and third-party assistants.
The catch nobody advertises
Augmented analytics amplifies whatever foundation it sits on. Point a natural language interface at ungoverned tables and it will produce fluent, confident, wrong answers at a speed no human analyst could match. Point it at a well-maintained semantic layer and it genuinely collapses the time from question to answer.
Devoteam's 2026 assessment of Looker's conversational features made this point directly: most failed rollouts trace back to LookML quality rather than to the AI technology. The same logic applies to every vendor.
Gartner's 2026 predictions carry a related warning — that by 2030 half of AI agent deployment failures will stem from insufficient governance and interoperability rather than from model capability, and that ungoverned LLM-driven decisions will cause financial and reputational loss in the near term.
Where to actually invest
A rough diagnostic. If different teams produce different values for the same metric, you have a descriptive problem — fix definitions and build a semantic layer. If you can report numbers but cannot explain movements, you have a diagnostic gap — invest in decomposition and drill paths, not in ML. If you can explain the past but keep getting blindsided, predictive work is now worth funding. And only once you can predict reliably and have written down your real constraints does prescriptive work make sense.
Augmented analytics is worth switching on at any stage — but only after you can honestly say which governed metric it will be answering from.
Point a natural language interface at ungoverned tables and it will produce fluent, confident, wrong answers at a speed no human analyst could match.
Referenced in this piece: Google Cloud Looker — conversational analytics.
Want this level of rigor applied to your own analytics stack?
This guide comes from running BA/BI systems audits for real Indian enterprises — where the actual fix is decided by which stage of your analytics function is broken, not by which tool has the best demo. A Systems Audit tells you exactly where to start.
Book a Systems Audit arrow_forward